Speedup Examples
We present several examples of interactive big data analytics using Verdict. First, we will issue six analytic SQL queries to Verdict (which connects to Apache Impala). Second, we will issue the same queries directly to Impala (without using Verdict). Then, we will compare the answers from those two systems and the runtime for obtaining those answers.
Dataset Description
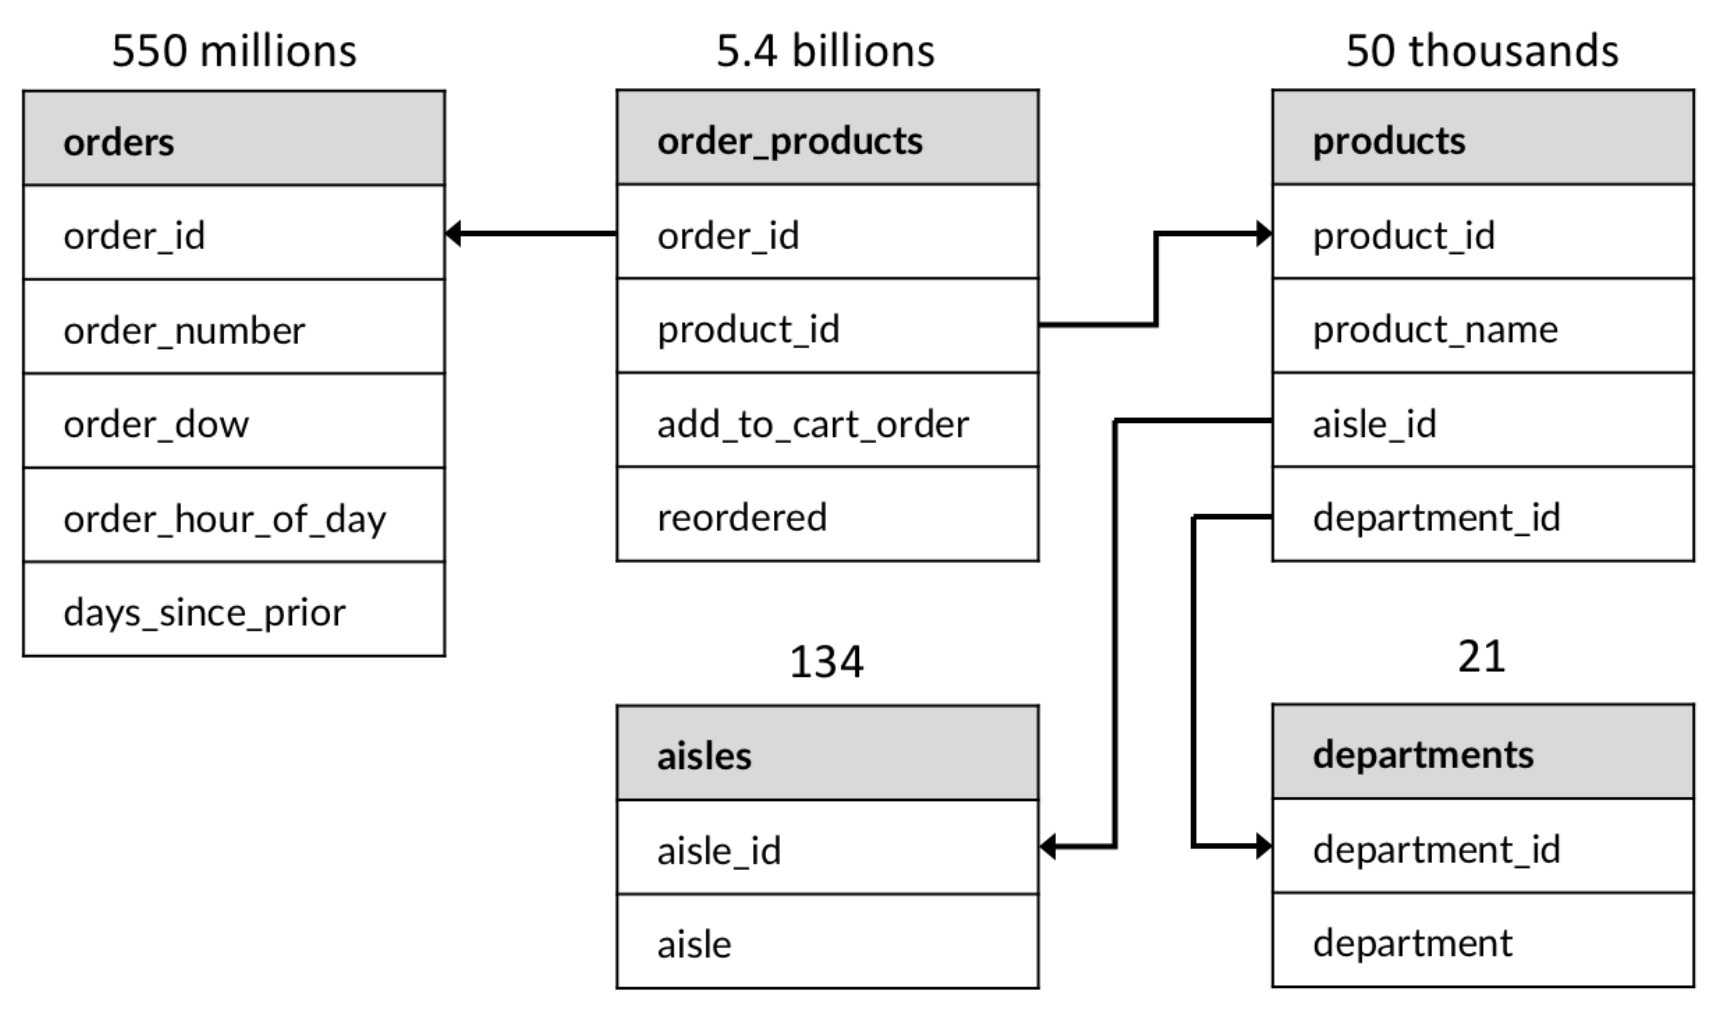
We generated 124 GB dataset by scaling (160 times) the publicly-available sales record of an actual online grocery store Instacart. We uploaded those data into Hadoop Distributed File System with five SSD-attached data nodes. The database schema of the dataset and the sizes of tables are shown below.
The schema of 124GB sales record dataset
Comparisons
The results on the left side are from Apache Impala and the results on the right side are from Verdict running on top of Impala. We used Hue for front-end visualizations. You can find in this page how to configure Hue to connect to Verdict without changing any code.
Q1. Simple Aggregation
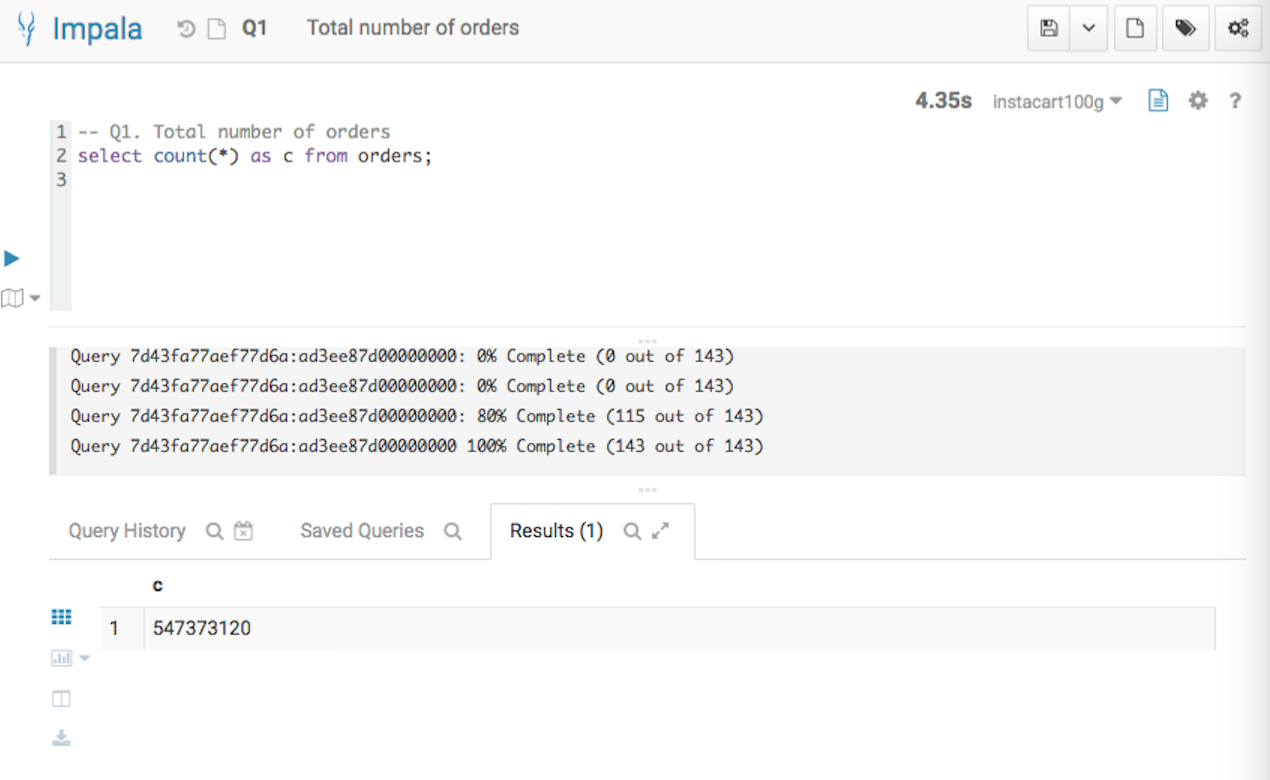
The first query asks the total number of orders in the dataset.
-- Q1. Total number of orders
select count(*) as c from orders;
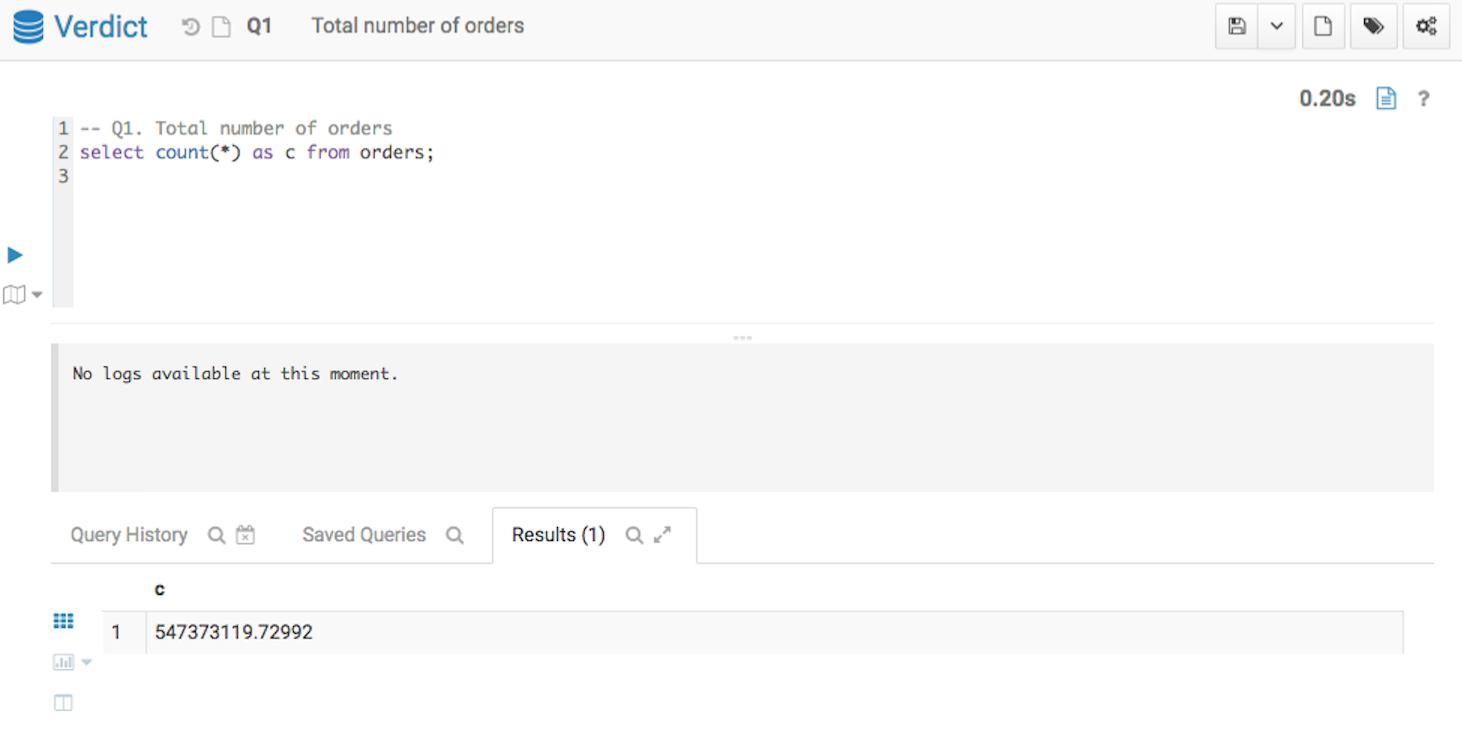
Below screenshots show the query answers from the two systems. Impala took 4.35 seconds, and Verdict took 0.20 seconds. Verdict achieved a 22 times speedup in this example.
Q1 Result from Impala
Q1 Result from Verdict
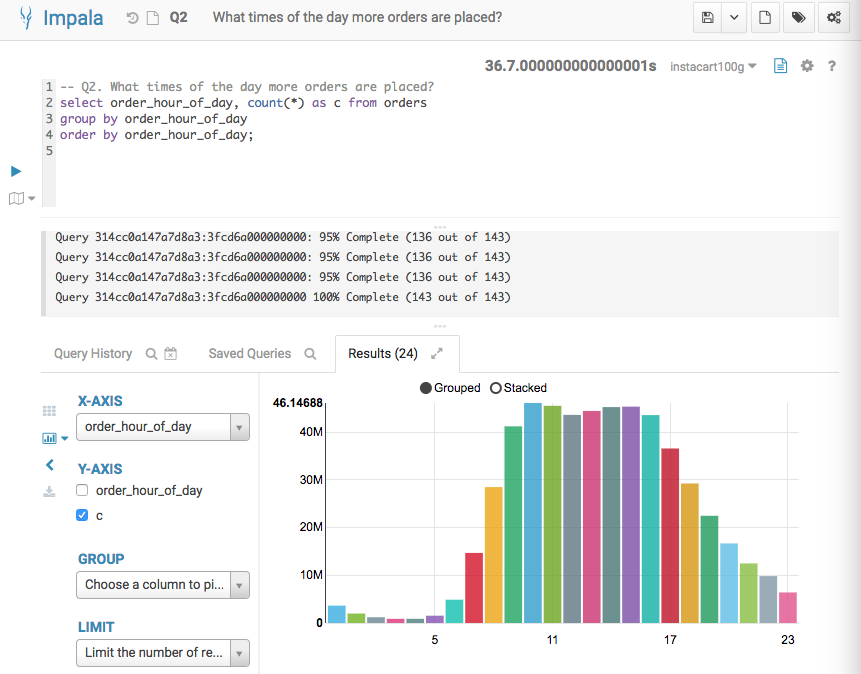
Q2. Aggregation with Grouping
The second query analyzes how the number of orders changes during the time of day, by counting the total number of orders for every hour.
-- Q2. What times of the day are more orders placed?
select order_hour_of_day, count(*) as c from orders
group by order_hour_of_day
order by order_hour_of_day;
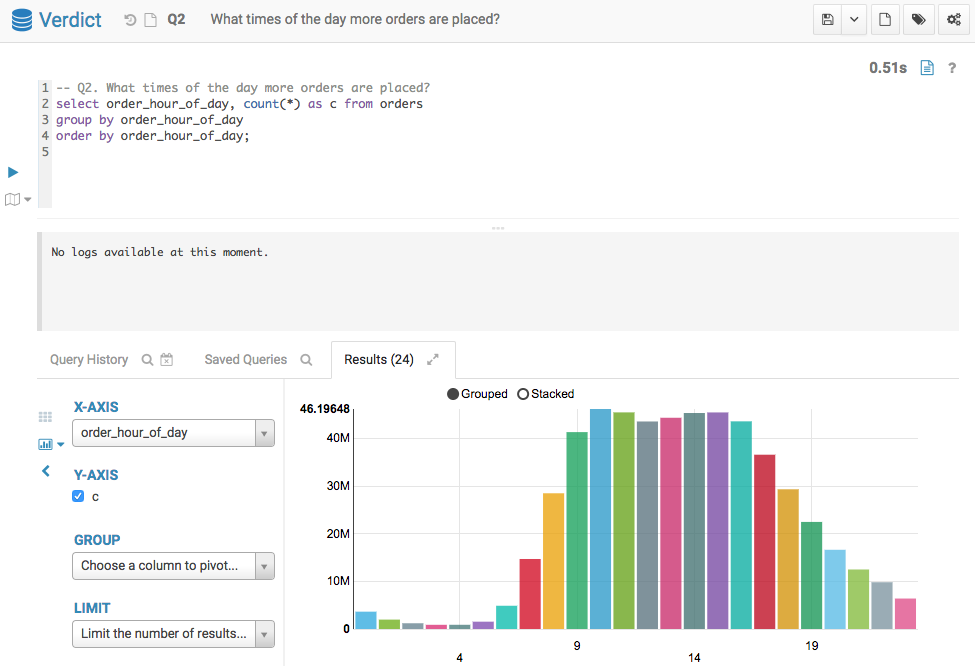
Below screenshots show the query answers from the two systems. Impala took 36.7 seconds, and Verdict took 0.51 seconds. Verdict achieved a 74 times speedup in this example.
Q2 Result from Impala
Q2 Result from Verdict
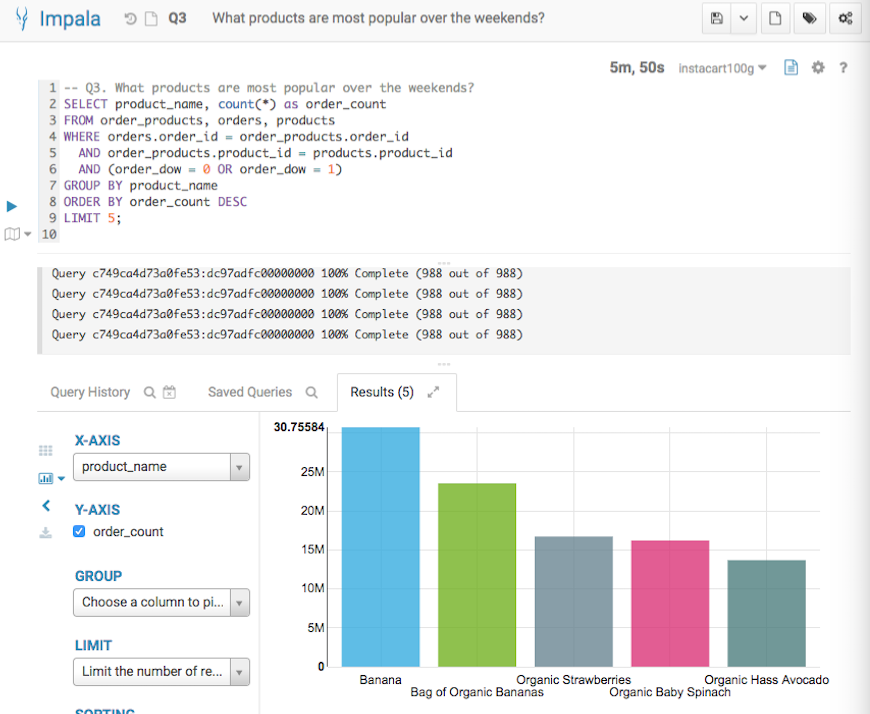
Q3. Aggregation + Grouping + Filter
The third query analyzes what products were mostly sold over the weekends.
-- Q3. What products were most popular over the weekends?
SELECT product_name, count(*) as order_count
FROM order_products, orders, products
WHERE orders.order_id = order_products.order_id
  AND order_products.product_id = products.product_id
  AND (order_dow = 0 OR order_dow = 1)
GROUP BY product_name
ORDER BY order_count DESC
LIMIT 5;
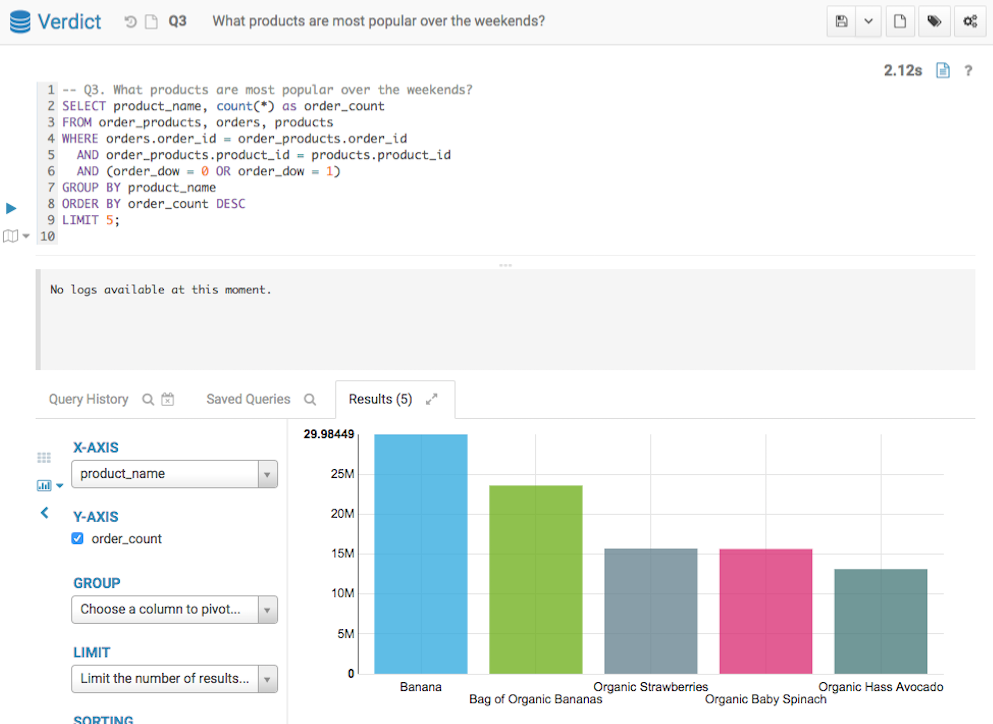
Below screenshots show the query answers from the two systems. Impala took 5 mins 50 seconds, and Verdict took 2.21 seconds. Verdict achieved a 165 times speedup in this example.
Q3 Result from Impala
Q3 Result from Verdict
Q4. Aggregation + Grouping + Filter
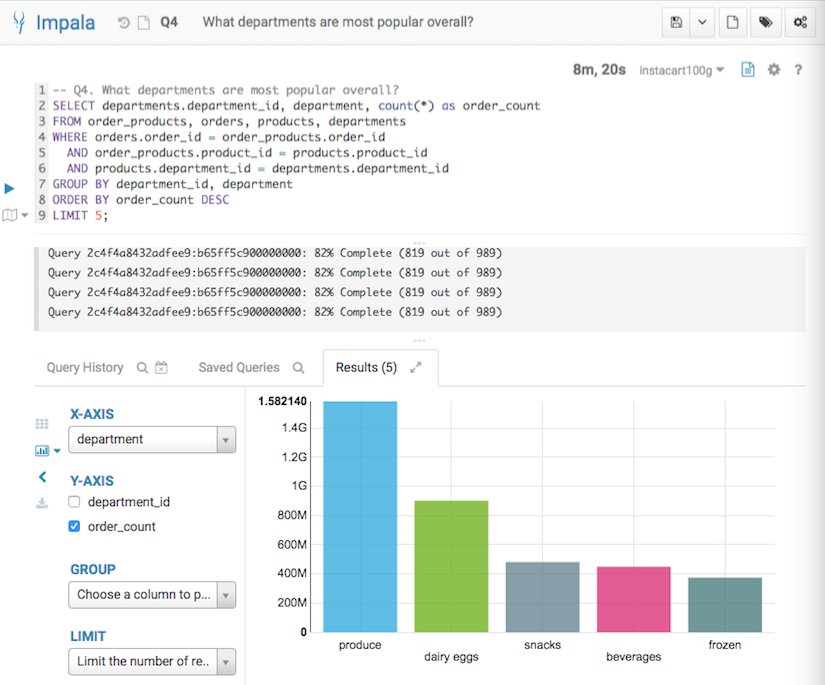
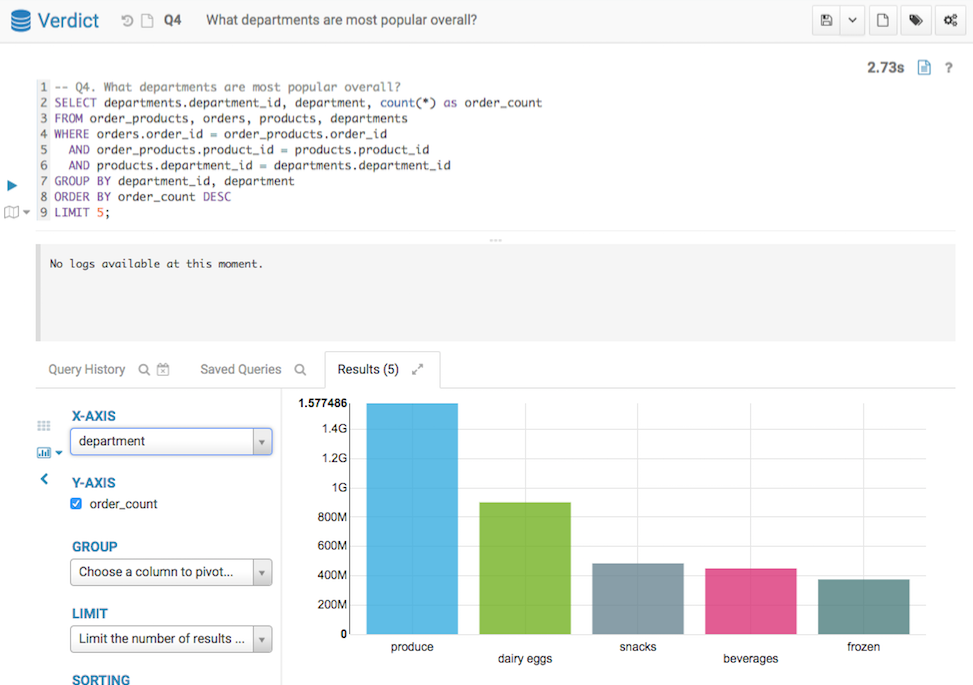
The fourth query analyzes what departments were the most popular overall.
-- Q4. What departments are most popular overall?
SELECT departments.department_id, department, count(*) as order_count
FROM order_products, orders, products, departments
WHERE orders.order_id = order_products.order_id
  AND order_products.product_id = products.product_id
  AND products.department_id = departments.department_id
GROUP BY departments.department_id, department
ORDER BY order_count DESC
LIMIT 5;
Below screenshots show the query answers from the two systems. Impala took 8 mins 20 seconds, and Verdict took 2.73 seconds. Verdict achieved a 183 times speedup in this example.
Q4 Result from Impala
Q4 Result from Verdict
Q5. Data Mining (Joins + Nested Queries)
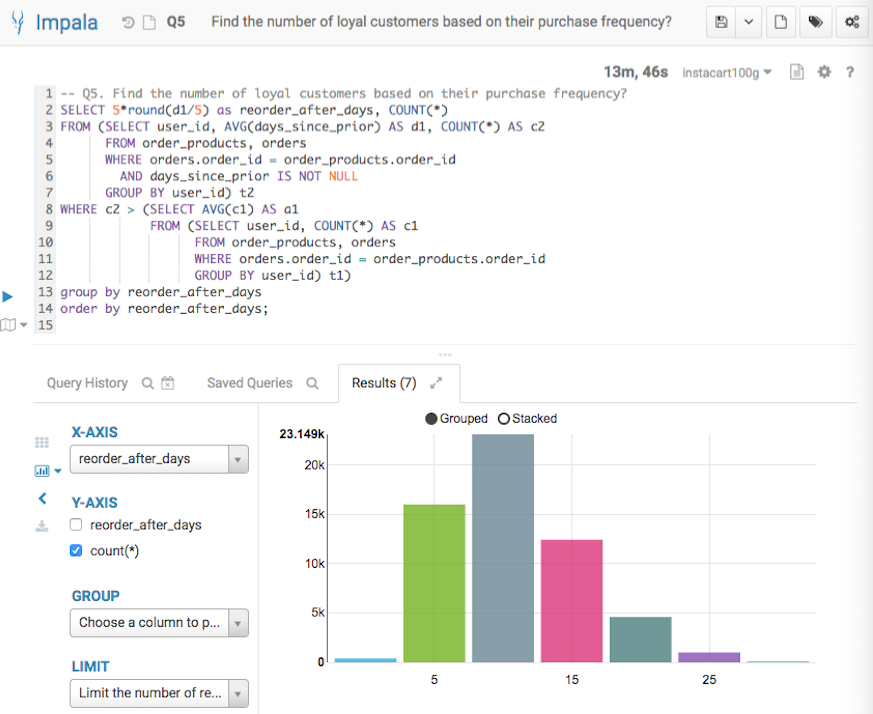
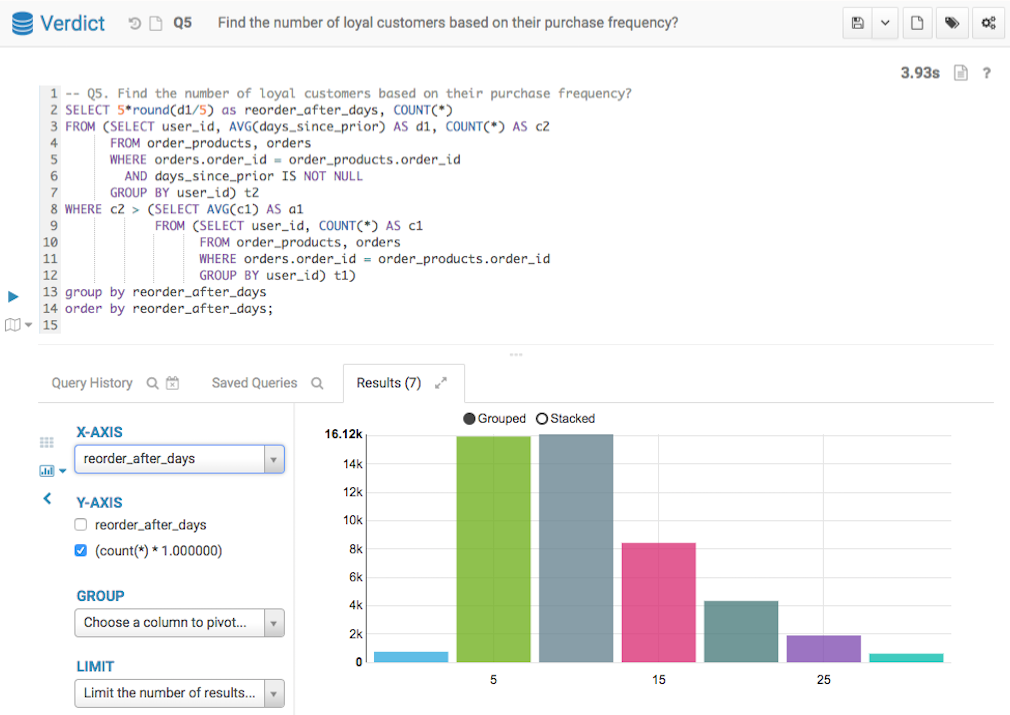
The fifth query analyzes the number of loyal customers by looking at the reorder frequency. This query only analyzes the customers who made orders more than average.
-- Q5. Find the number of loyal customers based on their purchase frequency?
SELECT 5*round(d1/5) as reorder_after_days, COUNT(*)
FROM (SELECT user_id, AVG(days_since_prior) AS d1, COUNT(*) AS c2
      FROM order_products, orders
      WHERE orders.order_id = order_products.order_id
        AND days_since_prior IS NOT NULL
      GROUP BY user_id) t2
WHERE c2 > (SELECT AVG(c1) AS a1
            FROM (SELECT user_id, COUNT(*) AS c1
                  FROM orders, order_products
                  WHERE orders.order_id = order_products.order_id
                  GROUP BY user_id) t1)
group by reorder_after_days
order by reorder_after_days;
Below screenshots show the query answers from the two systems. Impala took 13 mins 46 seconds, and Verdict took 3.93 seconds. Verdict achieved a 210 times speedup in this example.
Q5 Result from Impala
Q5 Result from Verdict
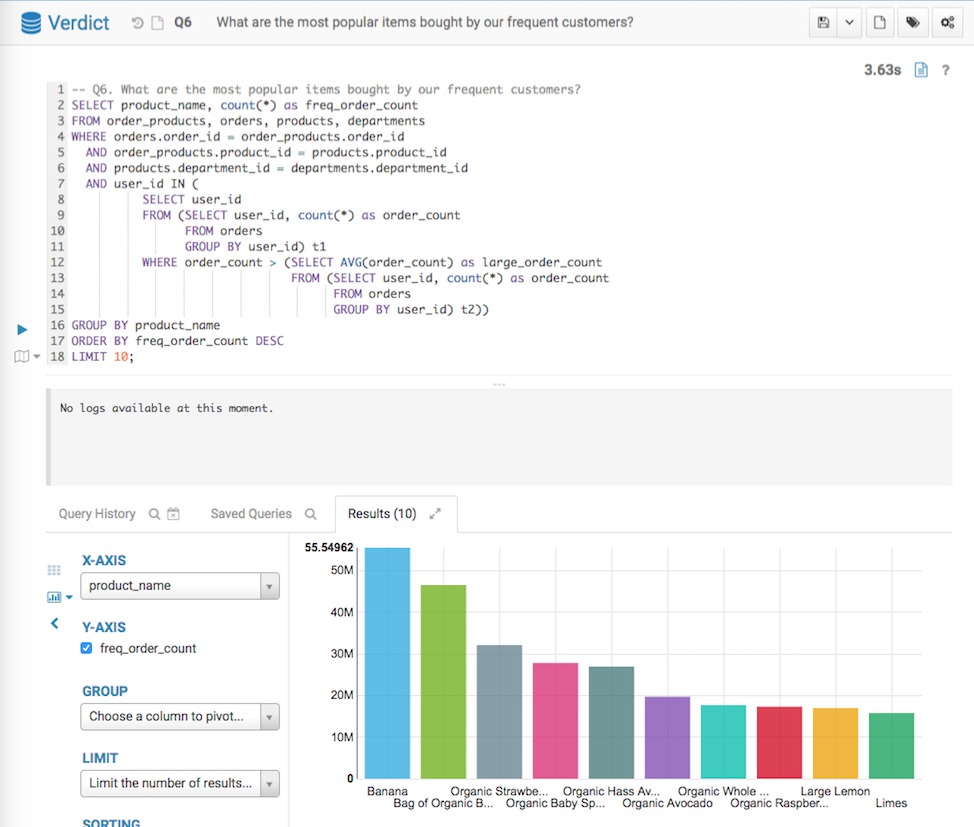
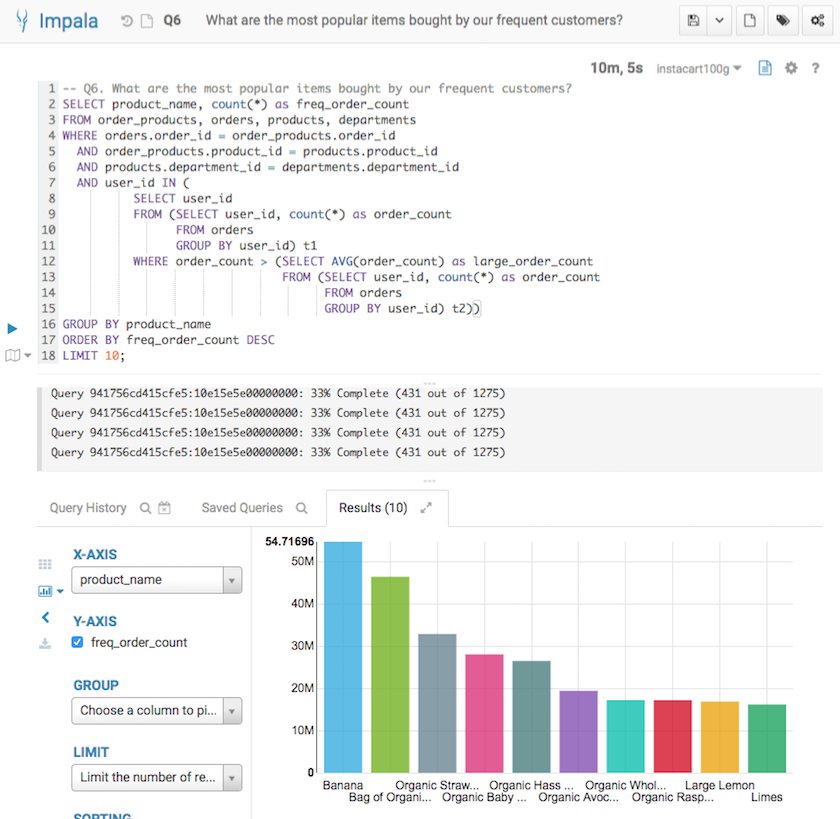
Q6. Data Mining (Joins + Nested Queries)
The sixth query analyzes the most popular items purchased by loyal shoppers.
-- Q6. What are the most popular items bought by our frequent customers?
SELECT product_name, count(*) as freq_order_count
FROM order_products, orders, products, departments
WHERE orders.order_id = order_products.order_id
  AND order_products.product_id = products.product_id
  AND products.department_id = departments.department_id
  AND user_id IN (
          SELECT user_id
          FROM (SELECT user_id, count(*) as order_count
                FROM orders
                GROUP BY user_id) t1
          WHERE order_count > (SELECT AVG(order_count) as large_order_count
                               FROM (SELECT user_id, count(*) as order_count
                                     FROM orders
                                     GROUP BY user_id) t2))
GROUP BY product_name
ORDER BY freq_order_count DESC
LIMIT 10;
Below screenshots show the query answers from the two systems. Impala took 10 mins 5 seconds, and Verdict took 3.63 seconds. Verdict achieved a 167 times speedup in this example.
Q6 Result from Impala
Q6 Result from Verdict